This file is: http://www.annedawson.net/pylab.html

Last updated: Monday 1st January 2018, 14:38 PT, AD
|
|
Creating Graphs on the Computer
*******************************

All the software required to create
your own plots of graphs of equations
and functions is completely free of charge.

By following these simple instructions
you can easily and quickly install
the software on your own computer.

Note: these instructions should work with any
recent version of Windows and have been tested on Windows 7
and Windows XP (see note on Windows XP below).


Once installed, you can then use the software to
quickly create your own graphs of equations and functions,
manipulate the plots,
and save them to pdf files (or another file format).


These are the steps you need to take to enable you
to use your computer to create graphs of any mathematical function.
These steps must be performed in the order presented:

1. Install Python 2.6 (an excellent programming language).
2. Install NumPy (an extension of Python for large arrays and array functions).
3. Install MatPlotLib (an extension of Python for plotting graphs of mathematical functions).
4. Test the software.
5. Create your own computer-generated graphs.
Sponsors:
1. Install Python 2.6 ********************* Note, Python 2.6 is NOT the latest version of Python, but is required in order to run the plotting functions provided by NumPy and MathPlotLib. Select the Microsoft Installation file: python-2.6.5.msi (Python 2.6.5 - 2010-03-18) from the following page: Installation files for Python running on Windows Click on the link above to download the python-2.6.5.msi installation file to your computer, then double click on the downloaded file to install Python 2.6.5. Just keep clicking on the Next button to accept all defaults when the installation is running. PROGRAMS REFERRED TO IN THIS DOCUMENT WILL NOT RUN ON PYTHON 3. The programs referred to in this document will run on any computer which has Python 2.5 or 2.6 installed, AND an installation of NumPy and matplotlib - as described in this document... 2. Install NumPy **************** NumPy is an extension to the Python programming language, adding support for large, multi-dimensional arrays and matrices, along with a large library of high-level mathematical functions to operate on these arrays. For more information on NumPy, visit: NumPy This is the installation file for NumPy: numpy-1.4.1-win32-superpack-python2.6.exe NumPy 1.4.1 downloads [Note for Windows XP users: On my Windows XP machine I'm running Python 2.6.1 and installed NumPy with this file: numpy-1.5.0b1-win32-superpack-python2.6.exe NumPy 1.5 downloads and everything works fine.] Click on either link above to download the selected file to your Windows computer, then double click on the downloaded file to install NumPy. Just keep clicking on the Next button to accept all defaults when the installation is running. 3. Installation instructions for Matplotlib ******************************************* Matplotlib is a plotting library for the Python programming language and its NumPy numerical mathematics extension. For more information on matplotlib, visit: Wiki Matplotlib and Sourceforge Matplotlib This is the installation file for Matplotlib: matplotlib-0.99.3.win32-py2.6.exe Matplotlib downloads Click on the link above to download the above file to your Windows computer, then double click on the downloaded file to install Matplotlib. Just keep clicking on the Next button to accept all defaults when the installation is running. IMPORTANT: After installing Matplotlib, the last step is to locate on your computer the file named: matplotlibrc If you did a default installation, you should find the file here: C:\Python26\Lib\site-packages\matplotlib\matplotlibrc edit the matplotlibrc file for backend, backend_fallback and interactive as follows:backend : TkAgg backend_fallback: True interactive : True4.Test the software ******************* To test the installations, create and run a simple (one line) Python 2.6 program script by following these instructions: Python 2 - Install and Run Once, you're satisfied that your installation of Python is OK, create a new program containing the following 5 lines:from pylab import * plot([1,2,3]) xlabel('x') ylabel('y') show()Hint: copy and paste the above directly into a new window of Python's IDLE editor: File -> New Window save the file as test0.py When you execute test0.py using the IDLE editor (Run -> Run Module), you should see a pylab plot window displaying a simple graph. This is what you should see:
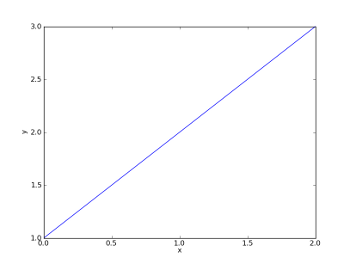 |
If not, refer to these instructions:
Matplotlib Installation Hints
but use the code above to test your installation.


IMPORTANT NOTE:
When running Python 2.6 IDLE,
don't attempt to select from the menu:
Run -> Run Module a second time while the
pylab plot window is still open - it will crash Python.
If this happens,
press Ctrl   Alt   and  Delete  keys together
to get to the Task Manager,
click on the Processes tab,
then highlight all occurences of pythonw.exe
and delete them all by clicking on the End Process button.
Restart Python 2.6,
then select from the menu bar, File -> Recent Files,
to open the last file you worked on.
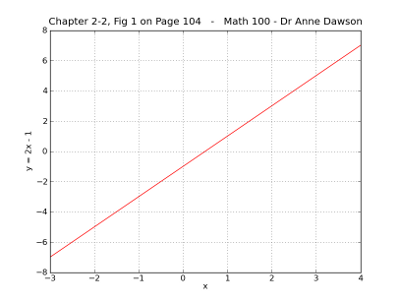
5. Create your own computer-generated graphs
********************************************

Example Python 2 programs using for matplotlib
and pylab can be found here:
Example math plotting programs

For example, a simple math plot program is shown here:
Example Simple Plot

and when the program runs
you can use the plot window tools
to manipulate the graph or save the graph
to a file in pdf or other format.

